


Data has established itself as the driving force in this era of machines and mechanical growth. Every organization, whether it be a financial institution or a health organization, is moving towards data solutions. How are we leveraging our data to address the current issues is still the key question.
Having worked in the data industry for a while. Daily, enormous volumes of data are collected from mini to macro devices, wristwatches to spacecraft. How might all this information benefit my company? How is the data at hand going to create a positive impact on my organization?
This is where Business understanding comes in. So what is business Understanding? Business intelligence (BI) is a technology-driven process for analyzing data and delivering actionable information that helps executives, managers and workers make informed business decisions. As part of the BI process, organizations collect data from internal IT systems and external sources, prepare it for analysis, run queries against the data and create data visualizations. From Dashboards to report generation Dashboards
Choice of Bussiness Intelligence Tools.
The organization and the region determine which business intelligence technologies are best. For instance, how can I choose which of the many BI tools to utilize, where to use it, and what kind of business employs it in my area? What qualifications should I have to work as a business information analyst? As a newcomer to the field, you already know where you are going with these questions in mind. Check this out at www.stitchdata.com" to learn which B. I. tool is best for your area or area of interest.
What next after Identifying and learning about the tool?
“Paper qualification is no longer enough in today’s competitive society. You need skills that people will pay for.”― Emi Iyalla
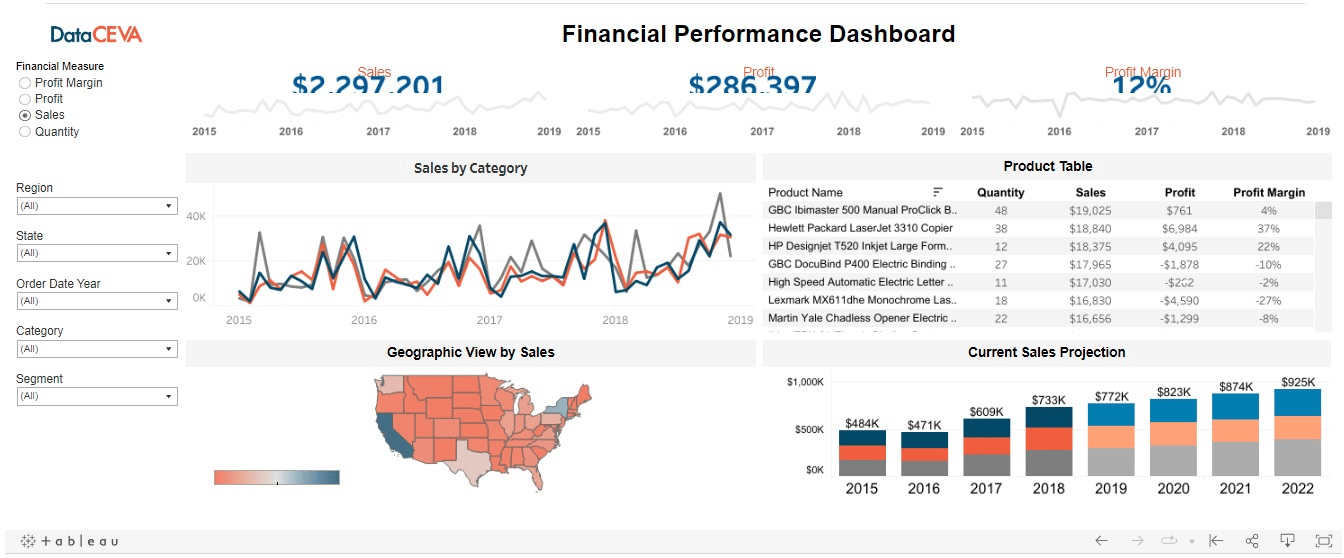
So how do you demonstrate your abilities? The greatest method to demonstrate your ability to use that tool to work with and manipulate data is through projects. Build intuitive and informative dashboards, they don't need to be complex simplicity communicates in its way.

Such simple dashboards convey a lot of information to the shareholders, and having these tools makes it possible to successfully present your findings.
Create reports using this tool, explaining in detail how the finding relates to the data while letting the graphics tell the story. Sample reports dashboard
So what comes next after understanding the facts and delivering the conclusions? What more services does the business or organization require of the data team?
Follow for more on data science Methodologies.